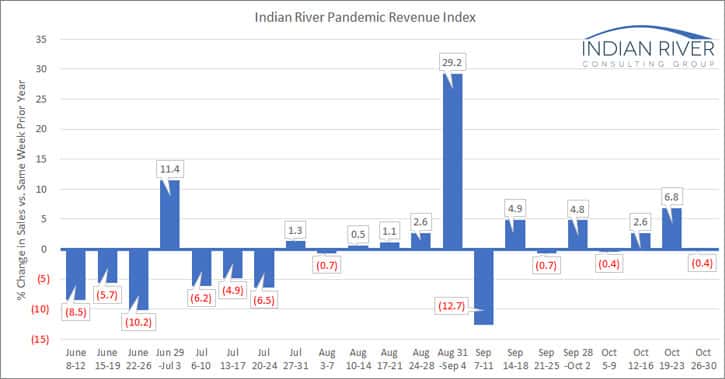
Each week, we’ll be tracking a snapshot of year-over-year distributor revenue with our Pandemic Revenue Index (PRI). We would like to increase the sample size and are asking you to consider helping the industry through these uncertain and unprecedented times. If you are interested, reach out to Mike Emerson, at memerson@ircg.com. The sample size for the week of October 26-October 30 is 13 firms, one more than last week.
This week’s index shows a sales decrease of 0.4% versus the same week in 2019. Seven respondents reported increases ranging from 1% to 27%. The range of decreases ranged from 1% to 25% for the remaining six respondents.
It’s interesting to note how the PRI has tracked with federal GDP data. GDP decreased 9% in the second quarter compared with the same quarter in 2019 per the Bureau of Economic Analysis (BEA) while the PRI averaged a decrease of 10.6%. In the third quarter, GDP was reported to decrease 2.9% while the PRI averaged an increase in 0.1%.
Thanks for following along with us as we analyze the impact of this pandemic. As we collect more experiences, we will continue to share patterns as they emerge.


